What is qualitative research?
Qualitative research is a research method that collects non-numerical data. Typically, it goes beyond the information that quantitative research provides (which we will cover below) because it is used to gain an understanding of underlying reasons, opinions, and motivations.
Qualitative research methods focus on the thoughts, feelings, reasons, motivations, and values of a participant, to understand why people act in the way they do.
In this way, qualitative research can be described as naturalistic research, looking at naturally-occurring social events within natural settings. So, qualitative researchers would describe their part in social research as the ‘vehicle’ for collecting the qualitative research data.
Qualitative researchers discovered this by looking at primary and secondary sources where data is represented in non-numerical form. This can include collecting qualitative research data types like quotes, symbols, images, and written testimonials.
These data types tell qualitative researchers subjective information. While these aren’t facts in themselves, conclusions can be interpreted out of qualitative that can help to provide valuable context.
Because of this, qualitative research is typically viewed as explanatory in nature and is often used in social research, as this gives a window into the behavior and actions of people.
It can be a good research approach for health services research or clinical research projects.
Free eBook: The qualitative research design handbook
Quantitative vs qualitative research
In order to compare qualitative and quantitative research methods, let’s explore what quantitative research is first, before exploring how it differs from qualitative research.
Quantitative research
Quantitative research is the research method of collecting quantitative research data – data that can be converted into numbers or numerical data, which can be easily quantified, compared, and analyzed.
Quantitative research methods deal with primary and secondary sources where data is represented in numerical form. This can include closed-question poll results, statistics, and census information or demographic data.
Quantitative research data tends to be used when researchers are interested in understanding a particular moment in time and examining data sets over time to find trends and patterns.
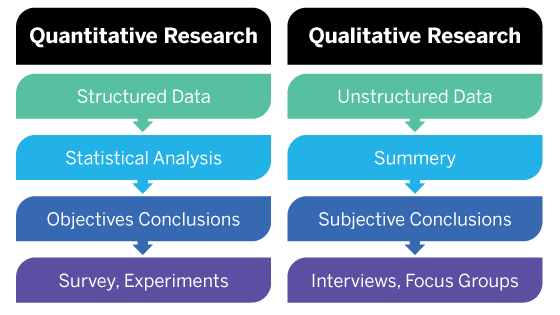
The difference between quantitative and qualitative research methodology
While qualitative research is defined as data that supplies non-numerical information, quantitative research focuses on numerical data.
In general, if you’re interested in measuring something or testing a hypothesis, use quantitative research methods. If you want to explore ideas, thoughts, and meanings, use qualitative research methods.
While qualitative research helps you to properly define, promote and sell your products, don’t rely on qualitative research methods alone because qualitative findings can’t always be reliably repeated. Qualitative research is directional, not empirical.
The best statistical analysis research uses a combination of empirical data and human experience (quantitative research and qualitative research) to tell the story and gain better and deeper insights, quickly.
Where both qualitative and quantitative methods are not used, qualitative researchers will find that using one without the other leaves you with missing answers.
For example, if a retail company wants to understand whether a new product line of shoes will perform well in the target market:
- Qualitative research methods could be used with a sample of target customers, which would provide subjective reasons why they’d be likely to purchase or not purchase the shoes, while
- Quantitative research methods into the historical customer sales information on shoe-related products would provide insights into the sales performance, and likely future performance of the new product range.
Approaches to qualitative research
There are five approaches to qualitative research methods:
- Grounded theory: Grounded theory relates to where qualitative researchers come to a stronger hypothesis through induction, all throughout the process of collecting qualitative research data and forming connections. After an initial question to get started, qualitative researchers delve into information that is grouped into ideas or codes, which grow and develop into larger categories, as the qualitative research goes on. At the end of the qualitative research, the researcher may have a completely different hypothesis, based on evidence and inquiry, as well as the initial question.
- Ethnographic research: Ethnographic research is where researchers embed themselves into the environment of the participant or group in order to understand the culture and context of activities and behavior. This is dependent on the involvement of the researcher, and can be subject to researcher interpretation bias and participant observer bias. However, it remains a great way to allow researchers to experience a different ‘world’.
- Action research: With the action research process, both researchers and participants work together to make a change. This can be through taking action, researching and reflecting on the outcomes. Through collaboration, the collective comes to a result, though the way both groups interact and how they affect each other gives insights into their critical thinking skills.
- Phenomenological research: Researchers seek to understand the meaning of an event or behavior phenomenon by describing and interpreting participant’s life experiences. This qualitative research process understands that people create their own structured reality (‘the social construction of reality’), based on their past experiences. So, by viewing the way people intentionally live their lives, we’re able to see the experiential meaning behind why they live as they do.
- Narrative research: Narrative research, or narrative inquiry, is where researchers examine the way stories are told by participants, and how they explain their experiences, as a way of explaining the meaning behind their life choices and events. This qualitative research can arise from using journals, conversational stories, autobiographies or letters, as a few narrative research examples. The narrative is subjective to the participant, so we’re able to understand their views from what they’ve documented/spoken.
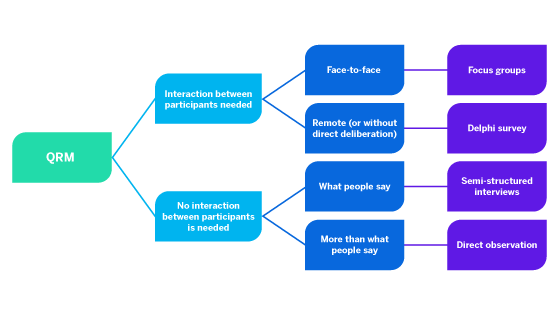
Qualitative research methods can use structured research instruments for data collection, like:
Surveys for individual views
A survey is a simple-to-create and easy-to-distribute qualitative research method, which helps gather information from large groups of participants quickly. Traditionally, paper-based surveys can now be made online, so costs can stay quite low.
Qualitative research questions tend to be open questions that ask for more information and provide a text box to allow for unconstrained comments.
Examples include:
- Asking participants to keep a written or a video diary for a period of time to document their feelings and thoughts
- In-Home-Usage tests: Buyers use your product for a period of time and report their experience
Surveys for group consensus (Delphi survey)
A Delphi survey may be used as a way to bring together participants and gain a consensus view over several rounds of questions. It differs from traditional surveys where results go to the researcher only. Instead, results go to participants as well, so they can reflect and consider all responses before another round of questions are submitted.
This can be useful to do as it can help researchers see what variance is among the group of participants and see the process of how consensus was reached.
Examples include:
- Asking participants to act as a fake jury for a trial and revealing parts of the case over several rounds to see how opinions change. At the end, the fake jury must make a unanimous decision about the defendant on trial.
- Asking participants to comment on the versions of a product being developed, as the changes are made and their feedback is taken onboard. At the end, participants must decide whether the product is ready to launch.
Semi-structured interviews
Interviews are a great way to connect with participants, though they require time from the research team to set up and conduct, especially if they’re done face-to-face.
Researchers may also have issues connecting with participants in different geographical regions. The researcher uses a set of predefined open-ended questions, though more ad-hoc questions can be asked depending on participant answers.
Examples include:
- Conducting a phone interview with participants to run through their feedback on a product. During the conversation, researchers can go ‘off-script’ and ask more probing questions for clarification or build on the insights.
Focus groups
Participants are brought together into a group, where a particular topic is discussed. It is researcher-led and usually occurs in-person in a mutually accessible location, to allow for easy communication between participants in focus groups.
In focus groups, the researcher uses a set of predefined open-ended questions, though more ad-hoc questions can be asked depending on participant answers.
Examples include:
- Asking participants to do UX tests, which are interface usability tests to show how easily users can complete certain tasks
Direct observation
This is a form of ethnographic research where researchers will observe participants’ behavior in a naturalistic environment. This can be great for understanding the actions in the culture and context of a participant’s setting.
This qualitative research method is prone to researcher bias as it is the researcher that must interpret the actions and reactions of participants. Their findings can be impacted by their own beliefs, values, and inferences.
Examples include:
- Embedding yourself in the location of your buyers to understand how a product would perform against the values and norms of that society
One-to-one interviews
One-to-one interviews are one of the most commonly used data collection instruments for qualitative research questions, mainly because of their approach. The interviewer or the researcher collects data directly from the interviewee one-to-one. The interview method may be informal and unstructured – conversational. The open-ended questions are mostly asked spontaneously, with the interviewer letting the interview flow dictate the questions to be asked.
Record keeping
This method uses existing reliable documents and similar sources of information as the data source. This data can be used in new research. It is similar to going to a library. There, one can go over books and other reference material to collect relevant data that can be used in the research.
Process of observation
In this data collection method, the researcher immerses themselves in the setting where their respondents are, keeps a keen eye on the participants, and takes notes. This is known as the process of observation.
Besides taking notes, other documentation methods, such as video and audio recording, photography, and similar methods, can be used.
Longitudinal studies
This data collection method is repeatedly performed on the same data source over an extended period. It is an observational research method that goes on for a few years and sometimes can go on for even decades. Such data collection methods aim to find correlations through empirical studies of subjects with common traits.
Case studies
This method gathers data from an in-depth analysis of case studies. The versatility of this method is demonstrated in how this method can be used to analyze both simple and complex subjects. The strength of this method is how judiciously it uses a combination of one or more qualitative methods to draw inferences.
What is data coding in qualitative research?
Data coding in qualitative research involves a systematic process of organizing and interpreting collected data. This process is crucial for identifying patterns and themes within complex data sets. Here’s how it works:
- Data Collection: Initially, researchers gather data through various methods such as interviews, focus groups, and observations. The raw data often includes transcriptions of conversations, notes, or multimedia recordings.
- Initial Coding: Once data is collected, researchers begin the initial coding phase. They break down the data into manageable segments and assign codes—short phrases or words that summarize each piece of information. This step is often referred to as open coding.
- Categorization: Next, researchers categorize the codes into broader themes or concepts. This helps in organizing the data and identifying major patterns. These themes can be linked to theoretical frameworks or emerging patterns from the data itself.
- Review and Refinement: The coding process is iterative, meaning researchers continuously review and refine their codes and categories. They may merge similar codes, adjust categories, or add new codes as deeper understanding develops.
- Thematic Analysis: Finally, researchers perform a thematic analysis to draw meaningful conclusions from the data. They explore how the identified themes relate to the research questions and objectives, providing insights and answering key queries.
Methods and tools for coding
- Manual Coding: Involves using highlighters, sticky notes, and physical organization methods.
- Software Tools: Programs like NVivo, ATLAS.ti, and MAXQDA streamline the coding process, allowing researchers to handle large volumes of data efficiently.
Data coding transforms raw qualitative data into structured information, making it essential for deriving actionable insights and achieving research objectives.
Qualitative data types and category types
Qualitative research methods often deliver information in the following qualitative research data types:
- Quotes
- Symbols
- Images
- Written testimonials
- Speeches
Through contextual analysis of the information, researchers can assign participants to category types:
- Religion
- Gender
- Social class
- Political alignment
- Most likely to purchase a product
- Their preferred training learning style
Why is qualitative data important?
Qualitative data plays a pivotal role in understanding the nuances of human behavior and emotions. Unlike quantitative data, which deals with numbers and hard statistics, qualitative data captures the vivid tapestry of opinions, experiences, and motivations.
Understanding emotions and perceptions
One primary reason qualitative data is crucial is its ability to reveal the emotions and perceptions of individuals. This type of data goes beyond mere numbers to provide insights into how people feel and think. For example, understanding consumer sentiments can help businesses tailor their products and services to meet customer needs more effectively.
Rich context and insights
Qualitative analysis dives deep into textual data, uncovering rich context and subtle patterns that might be missed with quantitative methods alone. This kind of data provides comprehensive insights by examining the intricate details of user feedback, interviews, or focus group discussions. For instance, companies like IBM and Nielsen use qualitative data to gain a deeper understanding of market trends and consumer preferences.
Forming research parameters
Researchers use qualitative data to establish parameters for broader studies. By identifying recurring themes and traits, they can design more targeted and effective surveys and experiments. This initial qualitative phase is essential in ensuring that subsequent quantitative research is grounded in real-world observations.
Solving complex problems
In market research, qualitative data is invaluable for solving complex problems. It enables researchers to decode the language of their consumers, identifying pain points and areas for improvement. Brands like Coca-Cola and P&G frequently rely on qualitative insights to refine their marketing strategies and enhance customer satisfaction.
Conclusion
In sum, qualitative data is essential for its ability to capture the depth and complexity of human experiences. It provides the contextual groundwork needed to make informed decisions, understand consumer behavior, and ultimately drive successful outcomes in various fields.
How do you organize qualitative data?
Organizing qualitative data is crucial to extract meaningful insights efficiently. Here’s a step-by-step guide to help you streamline the process:
1. Align with research objectives
Start by revisiting your research objectives. Clarifying the core questions you aim to answer can guide you in structuring your data. Create a table or spreadsheet where these objectives are clearly laid out.
2. Categorize the data
Sort your data based on themes or categories relevant to your research objectives. Use different coding techniques to label each piece of information. Tools like NVivo or Atlas.ti can help in coding and categorizing qualitative data effectively.
3. Use visual aids
Visualizing data can make patterns more apparent. Consider using charts, graphs, or mind maps to represent your categorized data. Applications like Microsoft Excel or Tableau are excellent for creating visual representations.
4. Develop a index system
Create an index system to keep track of where each piece of information fits within your categories. This can be as simple as a detailed index in a Word document or a more complex system within your data analysis software.
5. Summary tables
Develop summary tables that distill large amounts of information into key points. These tables should reflect the core themes and subthemes you’ve identified, making it easier to draw conclusions.
6. Avoid unnecessary data
Don’t fall into the trap of hoarding unorganized or irrelevant information. Regularly review your data to ensure it aligns with your research goals. Trim any redundant or extraneous data to maintain clarity and focus.
By following these steps, you can turn your raw qualitative data into an organized, insightful resource that directly supports your research objectives.
Advantages of qualitative research
- Useful for complex situations: Qualitative research on its own is great when dealing with complex issues, however, providing background context using quantitative facts can give a richer and wider understanding of a topic. In these cases, quantitative research may not be enough.
- A window into the ‘why’: Qualitative research can give you a window into the deeper meaning behind a participant’s answer. It can help you uncover the larger ‘why’ that can’t always be seen by analyzing numerical data.
- Can help improve customer experiences: In service industries where customers are crucial, like in private health services, gaining information about a customer’s experience through health research studies can indicate areas where services can be improved.
Disadvantages of qualitative research
- You need to ask the right question: Doing qualitative research may require you to consider what the right question is to uncover the underlying thinking behind a behavior. This may need probing questions to go further, which may suit a focus group or face-to-face interview setting better.
- Results are interpreted: As qualitative research data is written, spoken, and often nuanced, interpreting the data results can be difficult as they come in non-numerical formats. This might make it harder to know if you can accept or reject your hypothesis.
- More bias: There are lower levels of control to qualitative research methods, as they can be subject to biases like confirmation bias, researcher bias, and observation bias. This can have a knock-on effect on the validity and truthfulness of the qualitative research data results.
How to use qualitative research to your business’s advantage?
Qualitative methods help improve your products and marketing in many different ways:
- Understand the emotional connections to your brand
- Identify obstacles to purchase
- Uncover doubts and confusion about your messaging
- Find missing product features
- Improve the usability of your website, app, or chatbot experience
- Learn about how consumers talk about your product
- See how buyers compare your brand to others in the competitive set
- Learn how an organization’s employees evaluate and select vendors
6 steps to conducting good qualitative research
Businesses can benefit from qualitative research by using it to understand the meaning behind data types. There are several steps to this:
- Define your problem or interest area: What do you observe is happening and is it frequent? Identify the data type/s you’re observing.
- Create a hypothesis: Ask yourself what could be the causes for the situation with those qualitative research data types.
- Plan your qualitative research: Use structured qualitative research instruments like surveys, focus groups, or interviews to ask questions that test your hypothesis.
- Data Collection: Collect qualitative research data and understand what your data types are telling you. Once data is collected on different types over long time periods, you can analyze it and give insights into changing attitudes and language patterns.
- Data analysis: Does your information support your hypothesis? (You may need to redo the qualitative research with other variables to see if the results improve)
- Effectively present the qualitative research data: Communicate the results in a clear and concise way to help other people understand the findings.
How do you arrange qualitative data for analysis?
Transcribing and organizing your qualitative data is crucial for robust analysis. Follow these steps to ensure your data is systematically arranged and ready for interpretation.
1. Transcribe your sata
Converting your gathered information into a textual format is the first step. This involves:
- Listening to audio recordings: Jot down every nuance and detail.
- Reading through notes: Ensure all handwritten or typed notes are coherent and complete.
2. Choose a suitable format
Once transcribed, your data needs to be formatted for ease of analysis. You have several options:
- Spreadsheets: Tools like Microsoft Excel or Google Sheets allow for easy sorting and categorization.
- Specialized software: Consider using computer-assisted qualitative data analysis software (CAQDAS) such as NVivo, ATLAS.ti, or MAXQDA to handle large volumes of data efficiently.
3. Organize by themes
Begin to identify patterns or themes in your data. This method, often called coding, involves:
- Highlighting Key Points: Use different colors or symbols to mark recurring ideas.
- Creating Categories: Group similar themes together to form a coherent structure.
4. Label and store
Finally, label and store your data meticulously to ensure easy retrieval and reference. Label:
- Files and Documents: With clear titles and dates.
- Sections within Documents: With headings and subheadings to distinguish different themes and patterns.
By following these systematic steps, you can convert raw qualitative data into a structured format ready for comprehensive analysis.
Qualitative data analysis
Evaluating qualitative research can be tough when there are several analytics platforms to manage and lots of subjective data sources to compare.
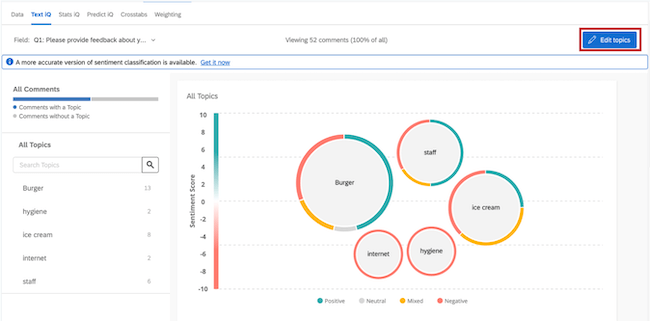
Qualtrics provides a number of qualitative research analysis tools, like Text iQ, powered by Qualtrics iQ, provides powerful machine learning and native language processing to help you discover patterns and trends in text.
This also provides you with:
- Sentiment analysis — a technique to help identify the underlying sentiment (say positive, neutral, and/or negative) in qualitative research text responses
- Topic detection/categorisation — this technique is the grouping or bucketing of similar themes that can are relevant for the business & the industry (e.g., ‘Food quality,’ ‘Staff efficiency,’ or ‘Product availability’)
Validating your qualitative data
Validating data is one of the crucial steps of qualitative data analysis for successful research. Since data is quintessential for research, ensuring that the data is not flawed is imperative. Please note that data validation is not just one step in this analysis; it is a recurring step that needs to be followed throughout the research process.
There are two sides to validating data:
- Accuracy of your research design or methods:
- Ensuring that the methods used are designed to produce accurate data.
- Reliability:
- The extent to which the methods consistently produce accurate data over time.
Incorporating these validation steps ensures that the qualitative data you gather through tools like Text iQ is both reliable and accurate, providing a solid foundation for your research conclusions.
What are the approaches to qualitative data analysis?
Qualitative data analysis can be tackled using two main approaches: the deductive approach and the inductive approach. Each method offers unique benefits and caters to different research needs.
Deductive approach
The deductive approach involves analyzing qualitative data within a pre-established framework. Typically, researchers use predefined questions to guide their analysis, making it a structured and straightforward process. This method is particularly useful when researchers have a clear hypothesis or a reasonable expectation of the data they will gather.
Advantages:
- Quick and efficient
- Suitable for studies with known variables
Disadvantages:
- Limited flexibility
- May not uncover unexpected insights
Inductive approach
Contrastingly, the inductive approach is characterized by its flexibility and open-ended nature. Rather than starting with a set structure, researchers use this approach to let patterns and themes emerge naturally from the data. This method is time-consuming but thorough, making it ideal for exploratory research where little is known about the phenomenon under study.
Advantages:
- High flexibility
- Uncovers insights that may not be immediately obvious
Disadvantages:
- Time-intensive
- Requires rigorous interpretation skills
Both approaches have their merits and can be chosen based on the objectives of your research. By understanding the key differences between the deductive and inductive methods, you can select the approach that best suits your analytical needs.
What is the inductive approach to qualitative data analysis?
The inductive approach to qualitative data analysis is a flexible and explorative method. Unlike approaches that follow a fixed framework, the inductive approach builds theories and patterns from the data itself. Here’s a closer look:
- No fixed framework: This method does not rely on predetermined structures or strict guidelines. Instead, it allows patterns and themes to naturally emerge from the data.
- Exploratory nature: Often used when little is known about the research phenomenon, this approach helps researchers unearth new insights without preconceptions.
- Time-consuming but thorough: Due to its comprehensive nature, the inductive approach can be more time-intensive. Researchers meticulously examine data to uncover meaningful connections and build a deep understanding of the subject matter.
- Flexible and adaptive: This approach is particularly useful in dynamic research environments where the subject matter is complex or not well understood.
In essence, the inductive approach is about letting the data lead the research, allowing for the discovery of unexpected insights and a more nuanced understanding of the studied phenomena.
The deductive approach to qualitative data analysis is a method where researchers begin with a predefined structure or framework to guide their examination of data. Essentially, this means they start with specific questions or hypotheses in mind, which helps in directing the analysis process.
Key elements of the deductive approach:
- Predetermined Framework:
- Researchers have a clear idea of what they are looking for based on prior knowledge or theories.
- This structured framework acts as a guide throughout the analysis.
- Using Questions as Guides:
- Specific questions are developed beforehand.
- These questions help in filtering and categorizing the data effectively.
- Efficient Analysis:
- The deductive method is typically faster and more straightforward.
- It is particularly useful when researchers anticipate certain types of responses or patterns from their sample population.
In summary, the deductive approach involves using existing theories and structured queries to systematically analyze qualitative data, making the process efficient and focused.
How to conclude the qualitative data analysis process
Concluding your qualitative data analysis involves presenting your findings in a structured report that stakeholders can readily understand and utilize.
Start by describing your methodology. Detail the specific methods you employed during your research, including how you gathered and analyzed data. This helps readers appreciate the rigor of your process.
Next, highlight both the strengths and limitations of your study. Discuss what worked well and areas that posed challenges, providing a balanced view that showcases the robustness of your research while acknowledging potential shortcomings.
Following this, present your key findings and insights. Summarize the main conclusions drawn from your data, ensuring clarity and conciseness. Use bullet points or numbered lists to enhance readability where appropriate.
Moreover, offer suggestions or inferences based on your findings. Identify actionable recommendations or indicate future research areas that emerged from your study.
Finally, emphasize the importance of the synergy between analytics and reporting. Analytics uncover valuable insights, but it’s the reporting that effectively communicates these insights to stakeholders, enabling informed decision-making.
How Qualtrics products can enhance & simplify the qualitative research process
Even in today’s data-obsessed marketplace, qualitative data is valuable – maybe even more so because it helps you establish an authentic human connection to your customers. If qualitative research doesn’t play a role to inform your product and marketing strategy, your decisions aren’t as effective as they could be.
The Qualtrics XM system gives you an all-in-one, integrated solution to help you all the way through conducting qualitative research. From survey creation and data collection to textual analysis and data reporting, it can help all your internal teams gain insights from your subjective and categorical data.
Qualitative methods are catered through templates or advanced survey designs. While you can manually collect data and conduct data analysis in a spreadsheet program, this solution helps you automate the process of qualitative research, saving you time and administration work.
Using computational techniques helps you to avoid human errors, and participant results come in are already incorporated into the analysis in real-time.
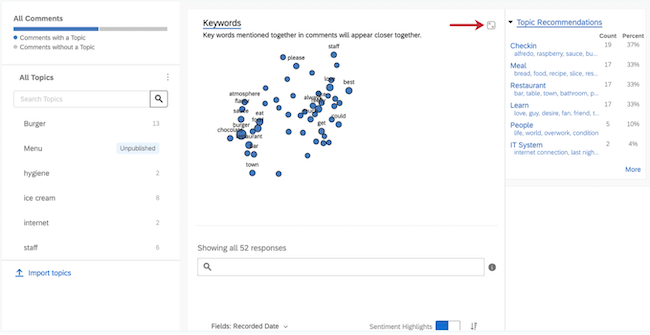
Our key tools, Text IQ™ and Driver IQ™ make analyzing subjective and categorical data easy and simple. Choose to highlight key findings based on topic, sentiment, or frequency. The choice is yours.
Some examples of your workspace in action, using drag and drop to create fast data visualizations quickly:
Free eBook: The qualitative research design handbook