How to calculate your Net Promoter Score (NPS)
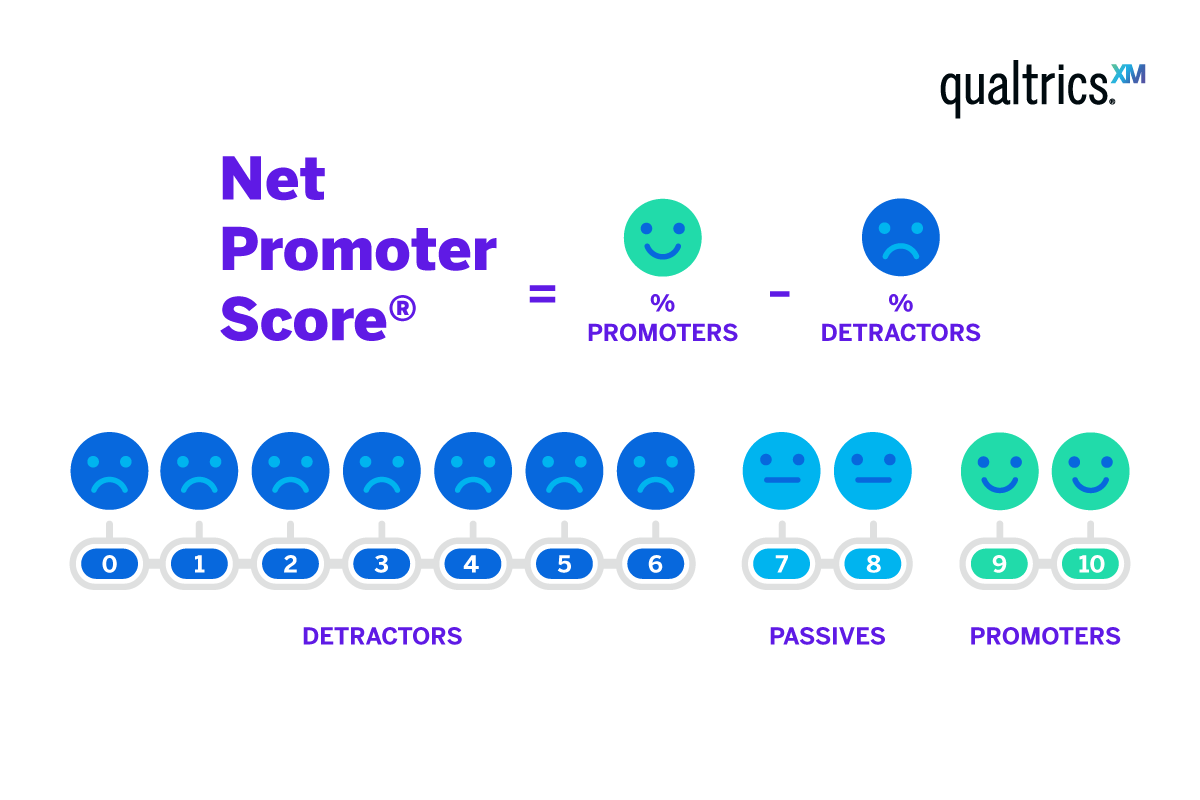
NPS is a metric that tells you your overall customer experience quality, based on your existing customers’ likelihood to recommend your product, service, or organisation. To do an NPS calculation, you’ll need to use the following Net Promoter Score (NPS) formula:
Total % of promoters – total % of detractors = net promoter score
This simply means:
The total % of people who would recommend your brand – the total % of those who wouldn’t = your net promoter score
For example, your Net Promoter Score calculation might look like:
70% promoters – 10% detractors = 60 is your NPS Score.
Get started with our free NPS survey template
NPS Calculator
The score is a whole number ranging from -100 to 100 and indicates happiness with brand experience. Use the NPS online calculator below to calculate your NPS from your survey responses.
NPS Calculator
Why should you calculate NPS?
In customer experience programs, managers and staff need to quantify the sentiment of customers to compare results and work towards better ones, by measuring customer’s experiences. Markers indicative of happy customers are brand loyalty, a positive level of customer satisfaction, or high reported levels of top-quality customer service.
This data can have a real impact on your future commercial strategy, budget-allocation, and product development plans. In these cases and others, NPS is used to get a representative landscape of how your customer base thinks about you.
But how exactly do you find out who would recommend your brand and who wouldn’t? And how do you know if your NPS calculation result is an average score, a great score or a bad one? Read on to find out more.

The NPS calculation in more depth
Think of one of your favourite personal brands. With the brand in mind, answer this question:
‘On a scale of 0-to-10, how likely is it that you would recommend this brand to a friend or colleague?’
As a customer, this question forces you to place a value on your experience with the brand and asks you to stand by it. Your colleagues and friends are people who trust you for your good sense of quality, and if they have a terrible experience after following your recommendation, their opinion of you will also be marred by the negative association.
So the question really being asked is: is recommending this brand going to elevate or risk your personal position with your hard-earned, trust-based relationships?
The Net Promoter Score formula replicates this process to a greater extent, working at a business-to-business level and directly asking their existing customers.
The scale is rated from 0 (not at all likely) to 10 (extremely likely). Depending on the responses, customers fall into one of 3 categories:
- Promoters are customers who respond with a score of 9 or 10. Typically, these customers are loyal and enthusiastic customers.
- Passives are customers who respond with a score of 7 or 8. These customers are satisfied with your service but not happy enough to be considered promoters.
- Detractors respond with a score of 0 to 6. These are unhappy customers who are unlikely to buy from you again, and may even discourage others from buying from you.
From examining the ratios of each group along the scale, you can see that there is more opportunity to be seen as a detractor, than as a passive or promoter.
Your score is measured with the following NPS calculation formula:
Subtract the percentage of detractors from the percentage of promoters.
Total % of promoters – total % of detractors = net promoter score
(The percentage of passives is not used in the Net Promoter Score formula.)
For example, if 10% of the total responses are from detractors, 20% are passives and 70% are promoters, your NPS score would be 70-10 = 60. Your NPS could range from -100 to 100. The ideal score would be 100, based on 100% of survey respondents being promoters.
Beware – when you calculate Net Promoter Score, the results can also be negative. When Charles Schwab, the inventor of NPS, evaluated the Corporation in 2003, he found they had an NPS of -35!
By understanding your net promoter score, and the kinds of customers that fit into each group, you’ll be able to take the actions needed to turn detractors into promoters. But how can you gather the needed data to get started?
Get started with our free NPS survey template
Gather feedback and build your Net Promoter Score data sets
Use NPS surveys to collect data
You might be tempted to start emailing your customers right away, but organisation is key to being successful. You’ll want to first ask yourself the following questions:
- What aspect of the business am I looking to measure: brand, service, or product?
- How are my customers segmented and which segments will I need to monitor?
- Is my current technology set-up to store results, interpret the data, and share reports?
- Do I want automated insights and tailored alerts to speed up the research time, or do I have time to investigate this myself?
Once you’ve established the answers to these questions, you can start planning your NPS surveys and outreach. Remember, you’ll need a high number of responses to be able to calculate your NPS more accurately. Higher response rates mean more data and a more in-depth picture of your customers’ real views. However, it’s worth bearing in mind that customers who are at the extremes of the NPS scale (very loyal and very unhappy) may skew results, as they’re more likely to want to share their opinion.
How NPS survey software can help
Researchers and customer experience experts will find that basic survey software doesn’t include all the things they need, like automated data analytics, or the ability to combine or compare multiple NPS exercises.
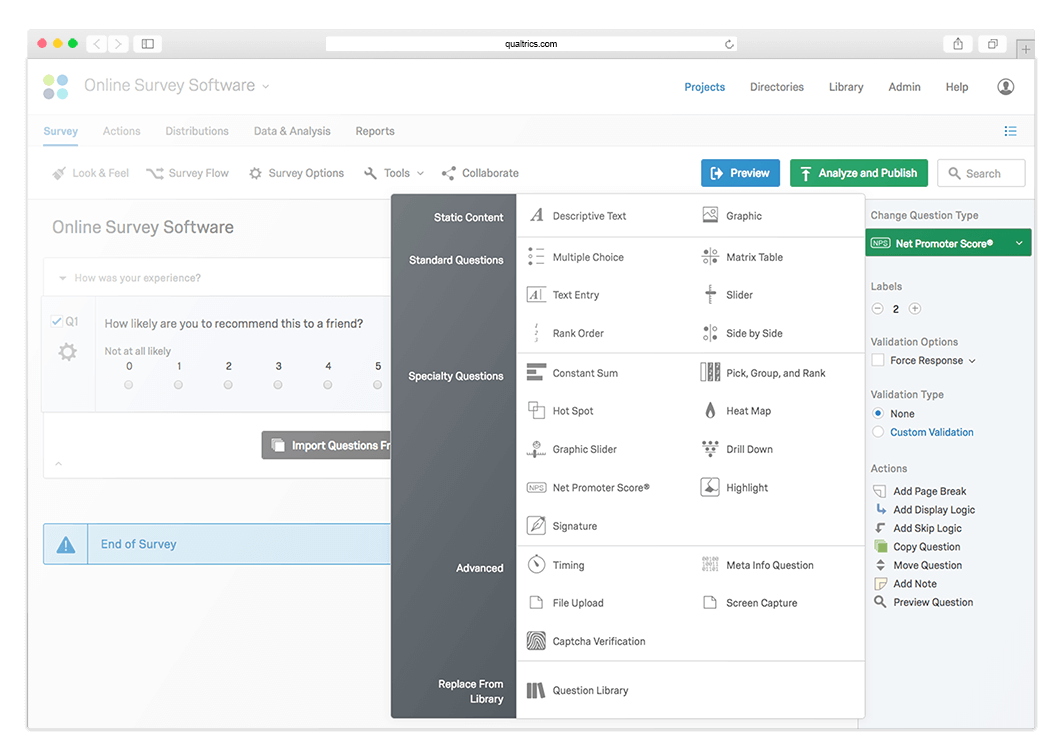
Qualtrics NPS Software allows you to measure, analyse, and improve your Net Promoter Score in 5 tailored and easy ways:
- Customers can conveniently provide feedback through multiple channels – including email, messaging apps, mobile, and more.
- Use flexible dashboards, pre-configured reports, and filters to segment customers by loyalty, monitor improvements, and give you the right information for business decisions in real-time.
- Use customised alerts to act quickly to improve the customer experience of your target audience and ‘close the loop’ with unsatisfied customers, so you can turn poor experiences into great ones.
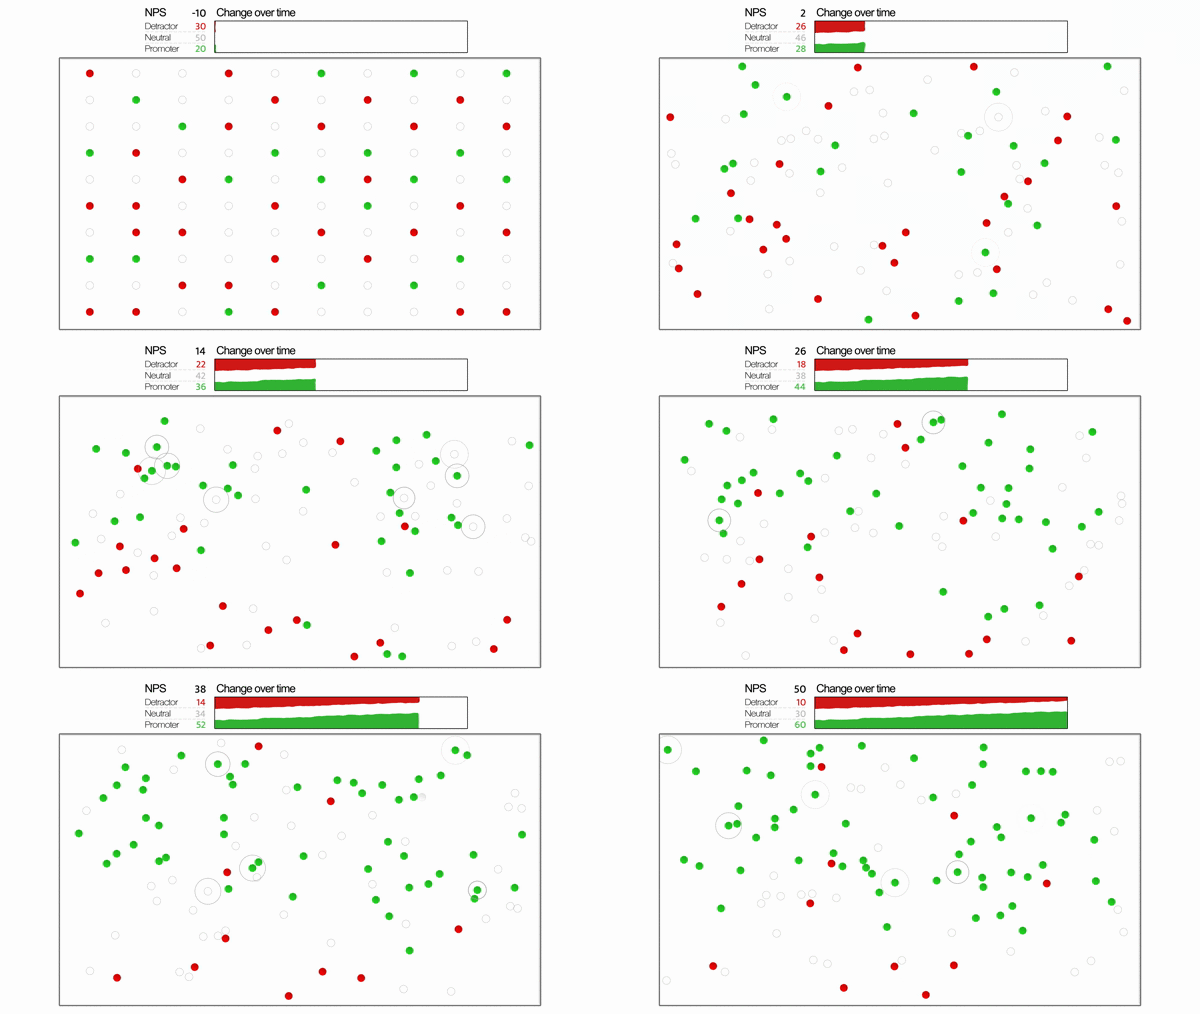
- You can view NPS exercises over the long-term, to see how your detractor percentage decreases, and your overall score increases. Here is a simulation showing how a company’s NPS can change over time, as detractors are turned into promoters:

- Identify customers at risk of churn (Passives and Detractors) so you can take steps to win them back. For example, if they rate your product or service 0-6, you can follow up with ‘We’re sorry to hear you were disappointed with our service. What could we do to improve in the future?’
Design an NPS Survey with additional questions
Measuring one NPS question alone is best for giving you a benchmark score for your customer experience. But how do you improve it? And what data should you gather alongside your NPS benchmarks to understand what’s driving your NPS score?
This is where key drivers come in. By understanding your customers’ experiences in more detail, you can establish the most important aspects of the experience that influence that score. It can also help you to narrow down if there’s a bias in your responses where only those with stronger views are responding.
Say for example you’re an online retailer. When a customer has completed a purchase with you, you send them a customer survey. As well as asking how likely they are to recommend your company, you might ask them:
- How easy was it to find the product you were looking for?
- What made you buy from us today [multiple choice]
- How easy were the following parts of your journey? [multiple choice]
In addition, you could also use operational data from things like your website analytics to layer in elements like:
- Time on page
- Referral URL
- Number of pages viewed
- Page load speed
That’s just a snapshot of the kind of data you could pull in. The more you include, the more data points you have to identify what’s really driving your NPS score calculation.
Analysing and utilising your NPS Score
Compare your Net Promoter Score to your industry benchmarks
A NPS calculation isn’t just useful for seeing how your brand is performing against customer expectations – it’s also useful for measuring your competitive performance against others in your industry.
A good Net Promoter Score for your business might not be enough to oust your competition, after all. If others in your industry are consistently retaining customers at a much higher rate than your business, it’s likely that they’ll draw their customer base to their business as well.
Use the Qualtrics free NPS benchmarking report to see how your Net Promoter Score calculation results stack up against your competitors. Using NPS data from more than 300 companies across 20 industries, the Qualtrics NPS benchmarking report helps you to identify new areas of potential growth by comparing your overall NPS score to others in your market.
Use your data to drive improved results and customer experience
Once you have calculated your NPS survey results and asked your audience about key drivers, you should have significant data points to be able to run advanced analyses like Key Driver Analysis or multivariate regression to identify your specific ways to improve the customer experience and your NPS scores. Alongside the NPS industry benchmarking report results, you’ll have a wealth of data to start growing your customer loyalty.
Key areas of customer experience you might look at to improve your NPS surveys’ results include:
- The customer journey: in your collected responses and open-ended feedback, which steps were highlighted as problematic?
- User experiences: How has website performance and usability affected customer loyalty?
- Brand engagement: Do you only engage with a small number of detractors when they reach out, or do you actively close the loop to turn detractors into promoters?
- Customer relationships: Do you reward loyalty, or is customer retention a lower priority for your brand than driving new relationships?
How Qualtrics can help calculate and improve your NPS score

Measuring customer loyalty is easy with Qualtrics. You can develop an NPS program that automatically sends out an NPS survey at every touchpoint on all channels customers prefer to use.
Don’t just calculate NPS – Increase the number of loyal customers by taking action, embedding customer experience as a priority across your organisation. Identify at-risk customers with a targeted NPS survey that gives you useful results and a roadmap to better customer relationships.
Get started with our free NPS survey template